Energy5 Zinc coating selection on the basis of soil aggressiveness studies
Many manufacturers of photovoltaic structures declare durability of their products in soil conditions; however, frequently those statements are not supported by any reliable studies or analyses. In practice, this may lead to serious problems associated with the structure corrosion and degradation, which may not only pose a risk to the structure’s energy efficiency, but also to its life.
Energy5 has met these challenges by introducing into its range soil aggressiveness studies in accordance with DIN 50 929-3, the standard defining a methodology for determining the soil corrosivity score. The company’s significant advantage in this area is the fact that it has extensive studies for materials, coatings, and complete structures.
Energy5 had tests conducted at renowned accredited laboratories to evaluate zinc coatings performance in different corrosive environments. Using them and its extensive base of results, as well as consultations with renowned research units, the company can extrapolate those results to any soil conditions. This unique approach guarantees that the zinc coating thickness is adjusted to specific soil conditions, thus extending the structure’s life and minimising the risk of its corrosion. For Energy5 customers this means a certainty that their photovoltaic system can be reliably operated for a long time, resulting in a significant competitive edge in the market for the company.
The effect of soil parameters on steel corrosion resistance
The soil is a complex corrosive environment, in which metal destruction processes are more intense than in the atmospheric conditions, while being characterised by instability in time. This instability results from dynamic changes both in the underground environment, and in the weather conditions, such as rainfall, or human influence. The majority of corrosion processes in metals driven into the soil are based on electrochemical mechanisms, depending mainly on chemical and physical properties of the soil in which they are installed. Key factors influencing those processes include, among others, soil texture, aeration, moisture content, pH, content of soluble components (mainly sulphates and chlorides), the ground water level, and the water retention capacity.
Understanding of those aspects is important for effective designing of photovoltaic structures to ensure durability and resistance to corrosion in soil conditions. The way in which soil parameters influence the resistance to corrosion of steel driven into soil is described below:
– soil texture, i.e. the mineral particle-size distribution, determines its composition and structure. Depending on values specified for percentage content of sand, clay, and silt, the soil classification for different families is established in accordance with the three-component diagram shown in Fig. 1;
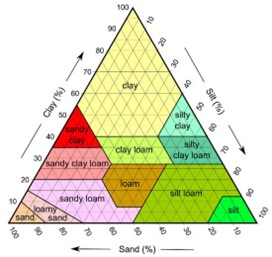
Smaller particles, such as silt fractions, can be particularly corrosive for steel structures driven into the soil due to their ability to absorb water and create an environment facilitating metal corrosion;
– soil aeration, especially in neutral or alkaline soils, significantly influences corrosion, because it is associated with oxygen availability, which can lead to metal oxidation processes. Oxidation-reduction potential, which reflects the level of soil aeration, can be an indicator for the risk of corrosion, as a high oxygen level may increase the corrosion rate;
– soil moisture content is an important factor influencing corrosion processes, as moisture forms an electrolyte in which electrochemical reactions responsible for corrosion occur;
– soil pH also may influence corrosivity; where acid soils may increase the risk of metal corrosion, while alkaline soils can form protective sediments on metal surfaces;
– soil chemical composition, especially the presence of chlorides and sulphates, may influence corrosion processes, as presence of those ions may increase the risk of metal corrosion;
– soil resistivity, i.e. its ability to conduct electricity, is a crucial indicator for corrosivity; a drop in resistivity may increase the risk of corrosion;
– bacteria in the soil may also accelerate corrosion processes; especially, anaerobic micorooganisms that may reduce sulphur compounds and initiate corrosion processes.
Methods for soil corrosivity assessment
The typology of data used for corrosion tests may be divided into two main categories: electrochemical and non-electrochemical.
In electrochemical tests, main measured variables include the corrosive potential, the electrical impedance, and the electrochemical noise. The potential refers to the voltage of the corroding electrode, as measured an open circuit in electrolyte. The current, or its density, is usually correlated with the corrosion rate or process characteristics, such as surface redox reactions, which may change corrosion characteristics. The polarisation resistance represents another parameter associated with the corrosion rate, inversely proportional to the corrosion current. A new method for measuring potentials of polarised electrodes in soil boxes for corrosion measurements, based on the improved Hickling’s method, was used by Denison and Darnielle.
Non-electrochemical data focuses on a direct visual inspection or weighing of corrosion defects, conducted for metal samples buried in the soil, both in field conditions and in simulated laboratory environments.
Due to the historical importance of resistivity in terms of its effects on metal corrosion, there are several tables relating the soil resistivity to the corrosion level. The most commonly used methods for assessment of aggressiveness were presented by NACE and the American Society for Testing and Materials (ASTM), and they are summed up in Table 1.
Table 1. Corrosivity assessment based on the soil resistivity according to the American Society for Testing and Materials (ASTM G187-12a: Standard test method for measurement of soil resistivity using the two-electrode soil box method) and the National Association of Corrosion Engineers (NACE).
| Soil resistivity (Ω.cm) | NACE | ASTM |
| > 10,000 | Insignificant | Very weakly corrosive |
| 5001–10,000 | Slightly corrosive | Slightly corrosive |
| 2001–5000 | Slightly corrosive | Moderately corrosive |
| 1001–2000 | Moderately corrosive | Strongly corrosive |
| 501–1000 | Corrosive | Extremely corrosive |
| 0–500 | Very corrosive | Extremely corrosive |
The developed classification of corrosion in the soil was related to its redox potential and pH.
European Norm 12501-2:2003 concerning protection of metallic materials against corrosion presents the methodology for the corrosion assessment. The standard provides for the qualitative assessment of the soil corrosivity, taking into account two variables, its pH and resistivity. This method suggests certain guidelines for determining the corrosion load in soil. Its limitation results from the fact that it establishes only three different levels of corrosion, high, medium, and low, as shown in Table 2.
Table 2. A risk of corrosion in soil as a function of the pH and the resistivity according to EN 12501-2:2003
| pH | Resistivity (Ω.cm) | Corrosion |
| <3.5 | Each | High |
| 3.5–4.5 | <4500 >4500 | High Medium-high |
| 4.5–5.5 | <4500 4500–5000 >5000 | High Medium-high Medium |
| 5.5–6.0 | <1000 1000–5000 5000–10000 >10 000 | High Medium-high Medium Medium-low |
| 6.0–9.5 | <1000 1000–3000 3000–10,000 10 000–20000 >20 000 | High Medium-high Medium Medium-low Low |
DIN 50 929-3 presents the methodology for assessment of the soil corrosivity score.
Table 3. DIN 50929-3, Corrosion of metals – Corrosion likelihood of metallic materials when subject to corrosion from the outside – Part 3: Buried and underwater pipelines and structural components.
| Symbol | Parameter | Unit | range | score |
| Z1 | Soil type Cohesive loose | % fraction | <10 10–30 30–50 50–80 >80 | +4 +2 0 -2 -4 -12 |
| Z2 | Resistivity | Ωm | >500 500–200 200–50 20–50 10–20 <10 | +4 +2 0 -2 -4 -6 |
| Z3 | Moisture content | % | <20 >20 | 0 -1 |
| Z4 | pH | >9 6–9 4–6 <4 | +2 0 -1 -3 | |
| Z5 | Alkaline buffering capacity | Mmol/kg | >1000 200–1000 <200 | +3 +1 0 |
| Z6 | Acid buffering capacity | mmol/kg | <2.5 2.5–5 5–10 10–20 20–30 >30 | 0 -2 -4 -6 -8 -10 |
| Z7 | Sulphate-reducing bacteria | Mmol/kg S-2 content | <5 5–10 >10 | 0 -3 -6 |
| Z8 | Sulphate content | mmol/kg | <2 2–5 5–10 >10 | 0 -1 -2 -3 |
| Z9 | Cl-1 and SO42- content in water extract | Mmol/kg | <3 3–10 10–30 30–100 >100 | 0 -1 -2 -3 -4 |
| Z10 | Ground water presence | None standard transient | 0 -2 -4 | |
| Z11 | Horizontal homogeneity | 0–4 | ||
| Z12 | Vertical homogeneity | 0–4 | ||
| Z13 | Backfilling homogeneity | 0–6 | ||
| Z14 | Anthropogenic inclusions E.g. limestone debris | absent present | 0 -6 | |
| Z15 | Presence of an external cathode | Structure/soil potential Cu/CuSO4 electrode, V | <-0.5 -0,5 to -0,4 -0,4 to -0,3 > -0.3 | 0 -3 -8 -10 |
The soil properties ranking, B0, is a sum of values from Z1 to Z10.
The local conditions ranking, B1, is a sum of values from Z11 to Z14.
Table 4. Assessment of the soil corrosivity on the basis of the table.
| B0 or B1 | Soil category | corrosion level | Corrosion likelihood of corrosion based on B1 | |
| Based on B0 | Pitting | Uniform corrosion | ||
| >0 | Ia | very low | very low | very low |
| -1 to -4 | Ib | low | low | very low |
| -5 to -10 | II | medium | medium | low |
| <-10 | III | high | high | medium |
Soil corrosivity calculations for hot-dip galvanised steel
Soil corrosivity calculations for hot-dip galvanised steel represent an important aspect for evaluation of photovoltaic structure durability. The nomenclature of available data indicates that the corrosion rate is the highest during first several years after installation of a structure, and later stabilises at a much lower level. In research studies, it is proposed to use exponential equation to forecast the overall corrosion after a specific time from the structure installation. It is worth emphasising that corrosion in the soil should be analysed in a different way than corrosion in weather conditions.
In accordance with market expectations, each manufacturer of PV should be able to determine the corrosivity index for the first year after structure installation. Then, they should use this data to provide a proof for correct selection of the anti-corrosion coating for a given period of a structure life, to be included in execution documentation. This document is currently very important for investor’s supervision, confirming durability of the designed structure.
Energy5 uses materials of the highest quality to manufacture steel structures; however, it does not rely solely on assurances of the steel manufacturer concerning usable properties of supplied raw materials. The company’s extensive cooperation with renowned research entities, and conducted zinc coatings tests in various corrosive environments facilitate the appropriate selection of photovoltaic structures, taking into account environment corrosivity categories and soil conditions. This approach ensures for investors and contractors of photovoltaic investments that manufacturer’s guarantees are based on tests of entire sets of products and are reliable.
| Sample appearance (after 1440 h) |

On this basis, Energy5 delivers to its customers relevant studies together with execution documentation. The entire process is based on soil studies in accordance with DIN 50 929-3, which defines a methodology for assessment of the soil corrosivity score.
If a customer does not have any studies in this respect, Energy5 can conduct them during pile driving tests. It is a new service, provided in cooperation with a proven laboratory. Additionally, Energy5 has the technical support in the form of equipment for field tests of the soil resistivity and pH.
Energy5 Sp. z o.o.
www.energy5.pl/en


